Recently a question came up about the age range of our software development team. I maintain a simple employee database in BBDB which includes, amongst other things, employees’ date of birth. All of the development team have a mail alias of “ukrd” so a simple BBDB query yields the records of the development team.
(defun employees ()
  "Return records of all R&D employees."
  (bbdb-search (bbdb-records) nil nil nil
               (cons 'mail-alias "ukrd")))
Getting a list of dates of birth is then relatively straight forward, although I had a few struggles with date and time processing. First of all, I invoked parse-time-string to handle my human entered textual dates of birth. Although this is documented to return a value “identical to decode-time”, the presence of nil for any unknown value causes later time processing functions to throw an error. Replacing nil with an arbitrary 0 solves this problem.
(require 'parse-time)
(require 'dash)

(defun time-val-to-years (tv)
  (floor
   (/ (float-time tv) 60 60 24 365)))

(defun date-from-field (record field)
  "Return a time value representing a date extracted from a BBDB record."
  ;; parse-time-string uses nil to show undefined fields, we replace
  ;; `nil' with `0' so that time-* calculations can be conducted on
  ;; the returned value.
  (apply #'encode-time
         (-replace
          nil
          0
          (parse-time-string
           (bbdb-record-xfield record
                               field)))))


(setq dobs (mapcar (lambda (record)
                     (date-from-field record 'date-of-birth))
                   (grc-pexip-ukrd)))

(defun age (dob)
  "Given a date of birth, return age in years, rounded down."
          (time-val-to-years (time-subtract nil dob)))

(setq ages (mapcar #'age dobs))
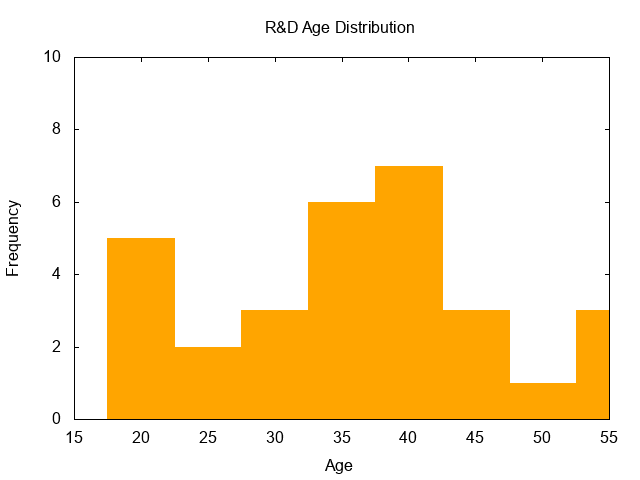
Given the ages of the R&D department my intent is to plot a histogram using gnuplot. As I’m not very familiar with that program I decided to bucketise the data using elisp and so simplify the plotting problem to simply drawing rectangles of a predetermined height. Five year buckets seem to provide about the right resolution, so round each age to the correct bucket and then count how many times each bucket occurs.
The resulting frequency table is captured in org-mode so that it can be used as an input to the gnuplot routine.
(defun bucketise (age bucket-size)
  (let ((index (round age bucket-size)))
    (* index bucket-size)))

(setq bucketised-ages (mapcar (lambda (age)
                                (bucketise age 5))
                              ages))

(defun frequencies (values)
    "Return a list indicating the frequency of values in VALUES list."
    (mapcar (-lambda ((value . items))
              (list value (length items))) ; list rather than cons so org-mode catches it right
          (-group-by #'identity
                     values)))

(frequencies (sort bucketised-ages #'<))
So we now have an org-mode table of ages and their respective frequencies. Not wanting to expose the ages of my colleagues to the internet, we’ll substitute a table of randomly generated ages:
| 20 | 5 |
| 25 | 2 |
| 30 | 7 |
| 35 | 3 |
| 40 | 4 |
| 45 | 1 |
| 50 | 3 |
| 55 | 5 |
This can then be fed to an org-mode gnuplot source block
#+BEGIN_SRC  gnuplot :var data=random-ages :file age.png :exports both
set title "R\\&D Age Distribution"
set xlabel "Age"
set ylabel "Frequency"

set style fill solid
set yrange[0:10]
set xrange[15:55]
set xtics 20,50,10

plot data with boxes notitle fillcolor "orange"
#+END_SRC